
Just like the traditional market, movements in the digital market can be identified through patterns that tend to repeat over multiple cycles. Our deep-dive into the fluctuations seen throughout the last quarter of 2022 yield insights into a rapidly shifting market and depict what could be signs of a bright, robust future for the coming year. You can find the full version of this report on our Academy, but here are the highlights:
Correlations in both markets
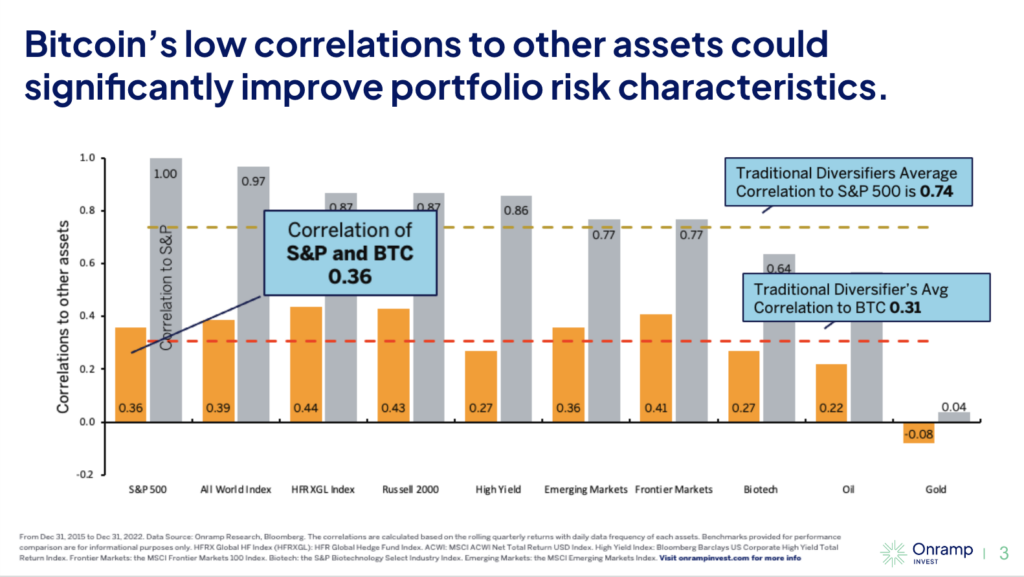
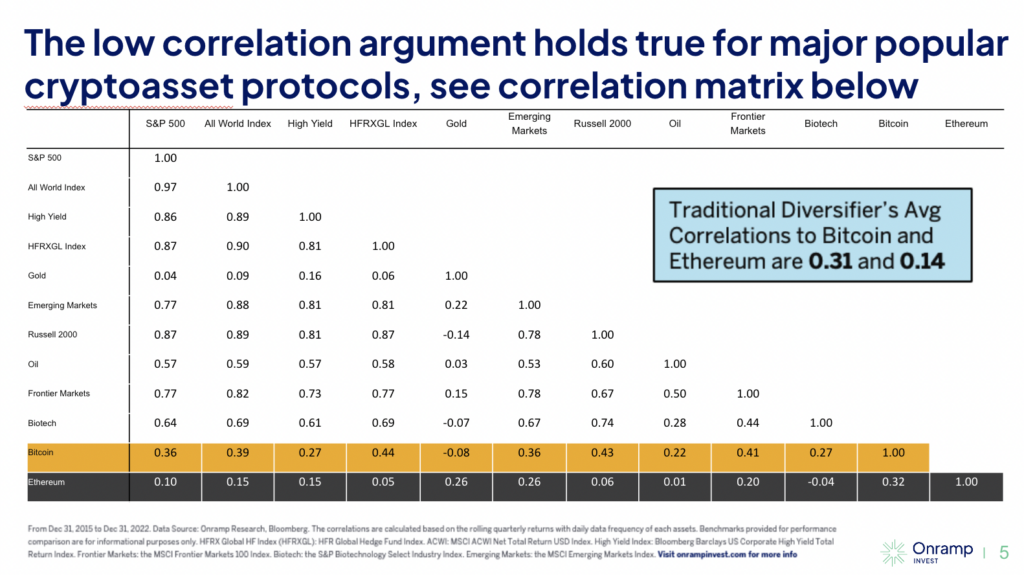
Highlight: Low-correlation assets are a crucial part of any portfolio, providing diversification and balance for client investments. Even with correlation increasing over the past year, BTC and ETH continue to show a low correlation to the traditional market over longer periods of time.
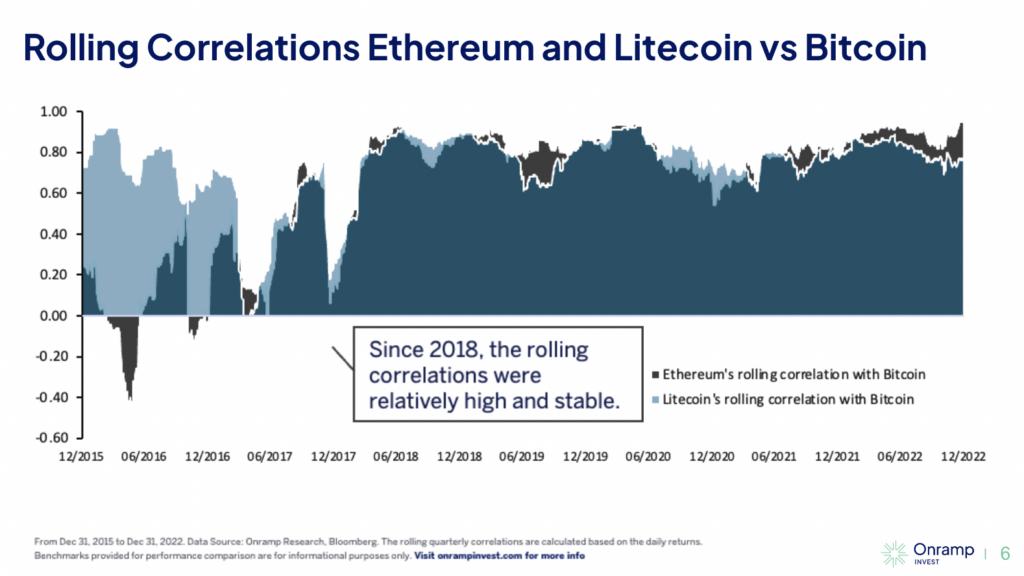
Meanwhile, the correlation between assets within the cryptocurrency market remain incredibly high, with bitcoin continuing to hold its place as the most dominant asset. When bitcoin moves, typically so does everything else, and typically in the same direction.
Crypto market patterns
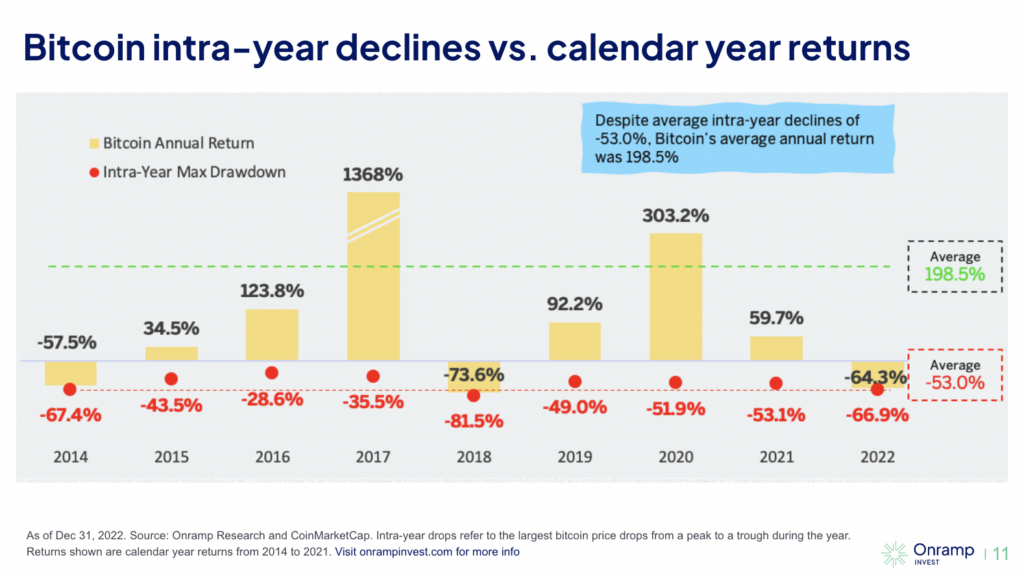
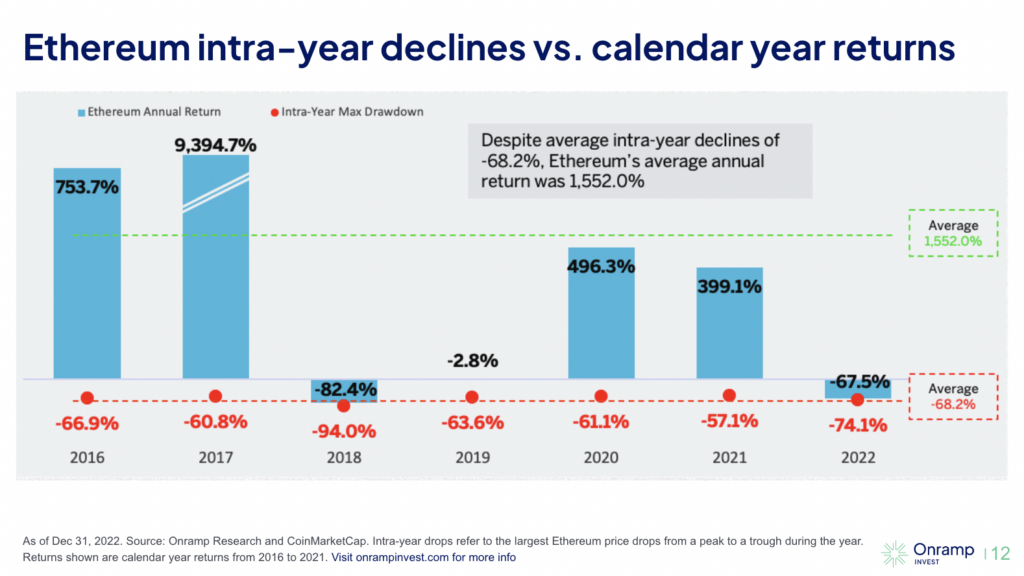
Highlight: Volatility is inherent to this asset class, it comes with the territory, and volatility isn’t necessarily a bad thing. Over the long term, BTC and ETH have historically generated outsized returns—and by a wide margin. However, there are periods of time in which bitcoin and ethereum have dropped significantly in value, most notably 2013, 2018, and 2022, but this can be compared to any emerging tech infrastructure. Let’s look at this in comparison to Amazon stock, which is no stranger to the average investor portfolio. The company’s history since going public in 1997 at $1.50 includes a 94% drawdown in 2001, a 64% drawdown in 2008, crashes greater than 40% in 1998, 1999, 2000 and corrections greater than 20% in 1997, 2006, 2010, 2011, 2012, 2014, 2016, 2018, and 2022. There were also double-digit drawdowns in 2017, 2019, 2020, and 2021. In almost every year of Amazon’s existence as a public company, it has had at least one double digit decline in its price.
Point being: These pains are reflected in the traditional market, too. Similarly to that, it could be said that crypto investors who were willing to weather the volatility and have a low time preference have historically seen enormous value appreciation.
Also, the crypto market has been known to move in four year cycles most likely due to bitcoin’s halving events occurring every four years. Historically, bitcoin has seen 3 consecutive years of positive returns followed by one down year.
Low volatility and market signals
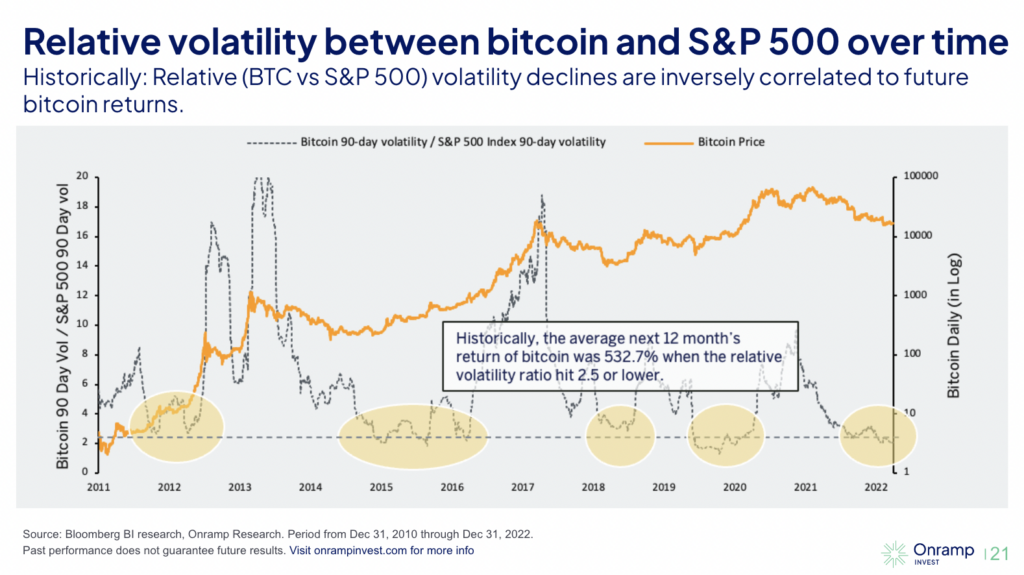
Highlight: As you can see above, bitcoin’s volatility has been consistently low over the last year. When you look at the patterns, you can see that low volatility for Bitcoin usually signals the end of a bear market, with a jump occurring shortly after. This most recent stint could be a sign that we’ve found the bottom of this bear market and will see a shift in 2023.
Crypto’s performance in a modern portfolio
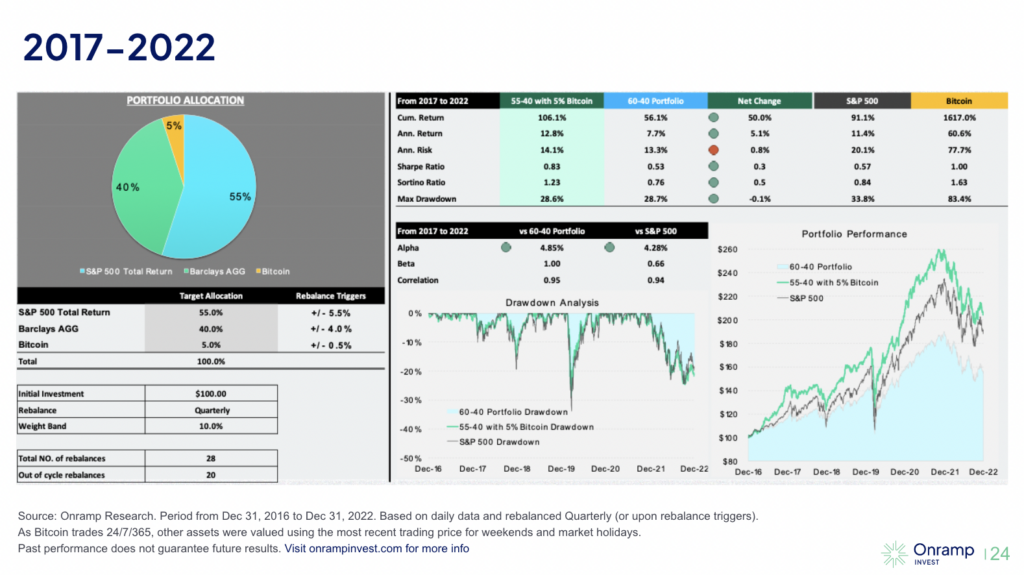
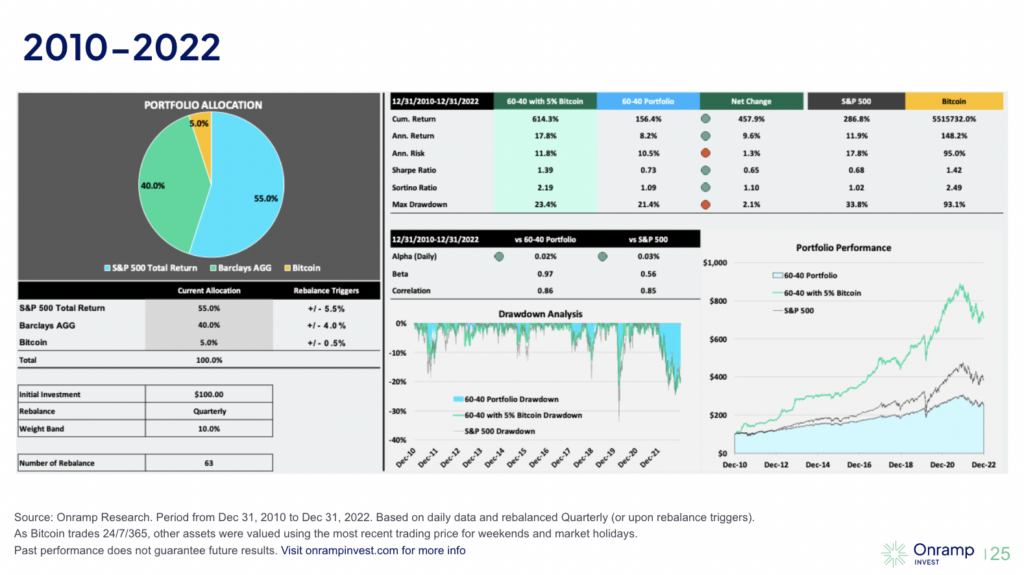
Highlight: Due to bitcoin’s low correlation to other assets and its historical return profile, adding just a small amount to a diversified portfolio significantly increases the sharpe ratio of that portfolio. In other words, bitcoin has predominantly increased returns without adding much additional risk when sized properly.
There’s more where that came from
Want to learn more? Check out the full report on our Advisor Academy. It’s free and it has everything you need to talk to your clients about the growing digital asset market.