One thing most people don’t know about bitcoin (BTC) is that an inflow of $1 million of capital does not mean the market cap of bitcoin increases by $1 million. In practice, the market cap rises significantly more than the amount of net inflow of capital which results in the price of bitcoin accelerating upwards as net inflows increase. This is what is known as the bitcoin multiplier effect and explains in part why bitcoin’s price goes on such parabolic growth spurts every few years.
Take the ETFs for example. One month after the ETFs launched, the total net inflow into all the bitcoin ETFs was just over $5 billion dollars. However, during that same time span, bitcoin’s market cap rose roughly $90 billion dollars to around $1 trillion. Now, in all fairness, over that month, the ETFs weren’t the only buyers and sellers of bitcoin. Although the ETFs have dominated volumes, there is still plenty of buying and selling on crypto exchanges throughout the world. So, the question becomes, can we measure how much the market cap moves for every net new dollar that is deployed into the bitcoin ecosystem? The answer is yes, yes we can.
Let’s do the math
There’s an on-chain metric called MVRV that has historically been a great indicator of market tops and bottoms. MVRV is a ratio comparing Market Value (MV) to Realized Value (RV). Market Value is simply another name for market cap, while Realized Value calculates the value of the network using the price at which each individual coin (or fraction of a coin) was last moved. Realized Value is thus a gross approximation of the network’s aggregate cost basis.
Rather than using this metric to identify market cycles, we can use the components of Market Value and Realized Value to calculate the bitcoin multiplier effect. By comparing the ratio of the percent change in both the Market Cap and the Realized Cap, we can measure the required net capital inflow/outflow to the Realized Cap required to enact a 1% change in Market Value. And if we know how much the market cap moves and we know how many BTC there are, we can determine how much price is likely to move for every dollar that is invested into bitcoin.
The blue line in the graph below is bitcoin’s Realized Value, and the grey shading shows how much investment is required to move bitcoin’s market cap by $1 at any given point over the last nine years. The red line shows the four year average of the grey-shaded area. Today, that four-year average is 0.24, meaning it takes $0.24 of net new investment to increase the market cap of bitcoin by one dollar. Said differently, the market cap rises on average by roughly $4 for every $1 of net inflow of capital. That’s a 4x multiplier.
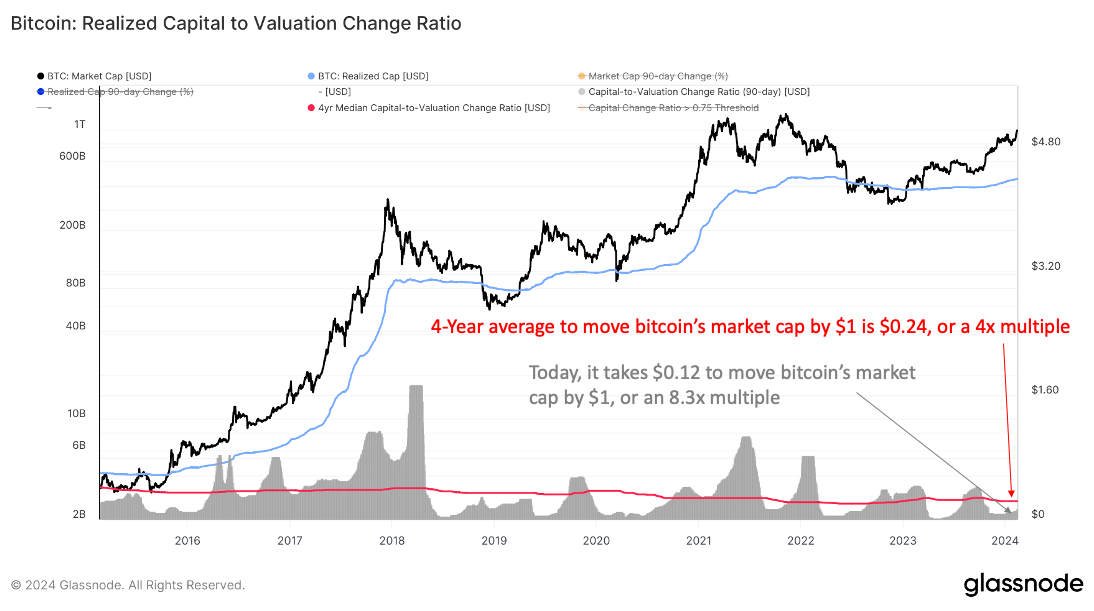
It’s also worth noting that the red line is sloped downwards which means over time, on average, it is taking less and less capital to increase the market cap (and thus the price) of bitcoin. In February of 2015, it took, on average, $0.41 to move the market cap to $1. That’s a 2.4x multiple. Today, that four-year average has grown to 4x, meaning the market cap of bitcoin is increasing significantly more for every dollar of investment than it did nine years ago.
So, we know that the average multiplier over the last four years is 4x. That gives us a good historical baseline, but it doesn’t tell us what the multiple is today. Looking at the shaded grey area, the data tells us that it currently only takes $0.12 to move the market cap by one dollar. That’s a multiple of 8.3x. Today, for every dollar that is currently invested, the market cap rises by $8.30.
“Over eight dollars per dollar? Explain.”
Why is the multiplier historically high right now? There could be several reasons. I’d argue it’s due to the growing supply shock bitcoin has been experiencing over the last couple of years. There is less and less available supply because there is an increasing tendency for investors to hold onto their bitcoin long-term. Less supply means greater movement in price when there is an increase in demand.
That’s why bitcoin’s market cap has risen by $90 billion since the ETFs launched, even though there was significantly less than that actually invested into bitcoin. Based on the multiplier, we can infer that there has been about a $10.5 billion net inflow of capital over that time, meaning the $5 billion from the ETFs made up just under half the capital inflow.
Given the current pace at which capital is flowing into the bitcoin ETFs, it’s not unreasonable to think we may see $25-$50 billion by the end of the year from the ETFs alone. Using today’s multiplier of 8.3x, that’s an increase of $200 billion – $415 billion in bitcoin’s market cap. There are roughly 19.6 million BTC outstanding, which means bitcoin’s price could rise to $60k – $75k on the back of the ETFs alone by the end of the year. That price doesn’t take into account any net inflows from Coinbase, Binance, Hedge Funds, or anyone else buying bitcoin, not through an ETF. If the ETFs remain roughly half of the volume as it is currently, that would suggest a possible $80k-$100k bitcoin price by the end of the year.
The big picture for bitcoin
Between the decreasing supply of bitcoin (after all, the next Halving is in April) and the increasing demand from consumers, this could be an interesting year for the world’s most established cryptocurrency. Price predictions in the hundreds of thousands per BTC in the next couple of years may seem ludicrous at first glance, but when you understand the supply and demand dynamics at play, it’s really not that hard to see how bitcoin’s price has the potential to skyrocket to those levels.
For RIAs and their clients
Even though bitcoin is becoming more of a household name, it’s still relatively new for investors, and they have a lot of questions. Many people want to invest in cryptocurrencies and tokenized assets but have no idea where to start. That’s where you, as an advisor, make all the difference, and that’s why we built Onramp specifically for financial professionals to trade, manage, and get paid on their clients’ crypto portfolios.
To access more insights like these for your clients, sign up for our bi-weekly research newsletter, The Node Ahead. For your clients investing in bitcoin, you can get started here.
Disclaimer: This is not investment advice. The content is for informational purposes only, you should not construe any such information or other material as legal, tax, investment, financial, or other advice. Nothing contained constitutes a solicitation, recommendation, endorsement, or offer to buy or sell any securities or other financial instruments in this or in any other jurisdiction in which such solicitation or offer would be unlawful under the securities laws of such jurisdiction. All Content is information of a general nature and does not address the circumstances of any particular individual or entity. Opinions expressed are solely that of Brett Munster and do not express the views or opinions of Onramp Invest.